Topics › KS3 › Statistics
Interpreting charts
-
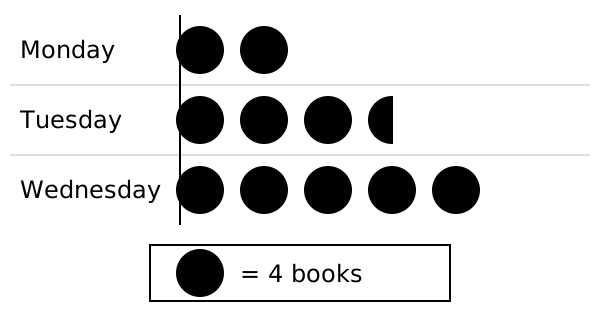
The pictogram shows books borrowed from a library. How many books were borrowed on Tuesday?
A
Option A:
$3.5$
B
Option B:
$13$
C
Option C:
$16$
D
Option D:
$14$
Answer and misconceptions
A
Option A:
$3.5$
✗
Counts symbols and ignores the keyCounts 3½ circles without multiplying by 4 books per circle.
B
Option B:
$13$
✗
Treats a part symbol as worth 1Works out 3 × 4 = 12 and adds 1 for the half circle; half a circle is worth 2.
C
Option C:
$16$
✗
Counts a part symbol as a whole symbolCounts 4 circles and works out 4 × 4 = 16.
D
Option D:
$14$
✓ Correct
-
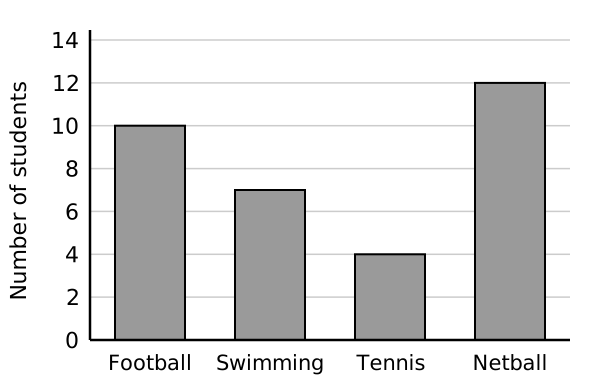
How many students chose swimming?
A
Option A:
$7$
B
Option B:
$3.5$
C
Option C:
$6$
D
Option D:
$6.5$
Answer and misconceptions
A
Option A:
$7$
✓ Correct
B
Option B:
$3.5$
✗
Counts grid squares, ignoring the scaleThe bar is 3½ squares tall, but each square is worth 2.
C
Option C:
$6$
✗
Reads only the labelled line below the barReads 6 and ignores the part of the bar above the gridline.
D
Option D:
$6.5$
✗
Treats half a grid gap as 0.5Assumes each gap is worth 1, so halfway past 6 becomes 6.5; halfway between 6 and 8 is 7.
-
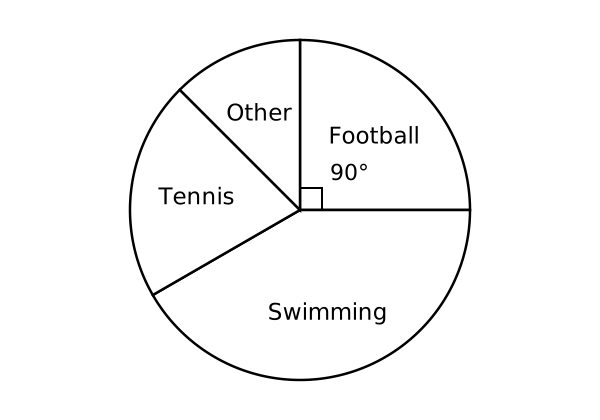
60 students were asked their favourite sport. How many chose football?
A
Option A:
$90$
B
Option B:
$25$
C
Option C:
$15$
D
Option D:
$54$
Answer and misconceptions
A
Option A:
$90$
✗
Reads the angle as the number of peopleGives 90 because the sector angle is 90°; 90° is ¼ of 360°, so ¼ of 60 = 15.
B
Option B:
$25$
✗
Gives the percentage, not the numberCorrectly sees a quarter = 25% but gives 25 instead of 25% of 60.
C
Option C:
$15$
✓ Correct
D
Option D:
$54$
✗
Treats the angle as a percentageWorks out 90% of 60 = 54, as if degrees were percentages.
-
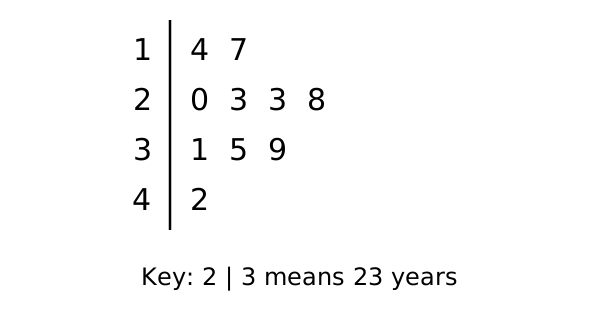
The stem-and-leaf diagram shows the ages of people at a party. What is the range of the ages?
A
Option A:
$3$
B
Option B:
$28$
C
Option C:
$9$
D
Option D:
$2.8$
Answer and misconceptions
A
Option A:
$3$
✗
Uses only the stemsWorks out 4 − 1 = 3 from the stems; the values are 42 and 14.
B
Option B:
$28$
✓ Correct
C
Option C:
$9$
✗
Uses only the leavesWorks out 9 − 0 = 9 from the largest and smallest leaves.
D
Option D:
$2.8$
✗
Reads stem and leaf as a decimalReads 4 | 2 as 4.2 and 1 | 4 as 1.4, ignoring the key, so gets 2.8.
-
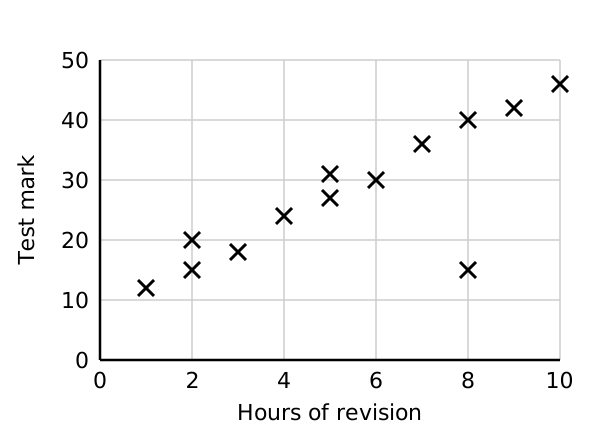
Which statement is best supported by the scatter graph?
A
Option A:
Revising more causes a higher mark
B
Option B:
Every student who revised more got a higher mark
C
Option C:
Students who revised more tended to get higher marks
D
Option D:
Students who revised less tended to get higher marks
Answer and misconceptions
A
Option A:
Revising more causes a higher mark
✗
Thinks correlation proves causationA scatter graph shows a relationship, not that one thing causes the other.
B
Option B:
Every student who revised more got a higher mark
✗
Thinks correlation applies to every individualCorrelation is a trend; the student at 8 hours and 15 marks breaks it.
C
Option C:
Students who revised more tended to get higher marks
✓ Correct
D
Option D:
Students who revised less tended to get higher marks
✗
Confuses positive and negative correlationPoints go up from left to right, so more revision goes with higher marks.